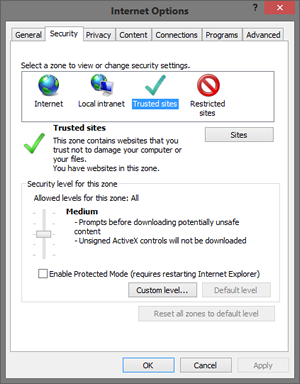
Internet Explorer has quite a complex security model compared to other browsers. One unique feature is the infamous Security Zone. Zones apply different policies to code based on the URL. By default, you have the following zones: Internet, Local Intranet, Trusted Sites, Restricted Sites, and My Computer.
Each of these zones has a slightly different configuration depending on the intended usage. For example, the Internet zone is designed to handle untrusted code from the internet. The settings are locked down tightly, and recent versions of IE run this code in a sandbox with Protected Mode.
Compare this to the Intranet zone which has a more relaxed configuration. If a URL is included in this zone it is considered to be trusted to a greater degree than one in the Internet zone. IE will even respond differently to authentication requests for sites in the Intranet zone to support Windows Authentication (see IWA, NTLM, Kerberos, and SPEGNO.)
Everything is fine and dandy when your application has code that only loads from URLs belonging to a single zone. However, things will start to go pear-shaped when you have code loading from different zones. The exact behaviour will depend on your application, but you'll often see inconsistent behaviour between environments. The explanation for this is often the application of group policy resulting in different connfigurations across machines.
So how do you go about debugging these issues? My approach is to start with the following:
Make sure the problem only happens in IE. Doing this will save you a lot of pain as debugging with the Chrome developer tools is often a more pleasant experience than using the IE tools.
Identify all of the domains hosting your code. Understand what zones contain your host page, and which ones contain other scripts or code that you are pulling in.
Temporarily move all of the code into a single zone. If you move all of your code into a single zone for testing you can confirm whether Protected Mode issues are at the heart of your problem. You may need to tweak some IE zone settings to get the features you need, but it's a good start.
Disable compatibility view. Sites in the Intranet zone use this feature by default, and it can cause problems. Temporarily turn it completely off for the Intranet Zone so that that things are consistent across zones.
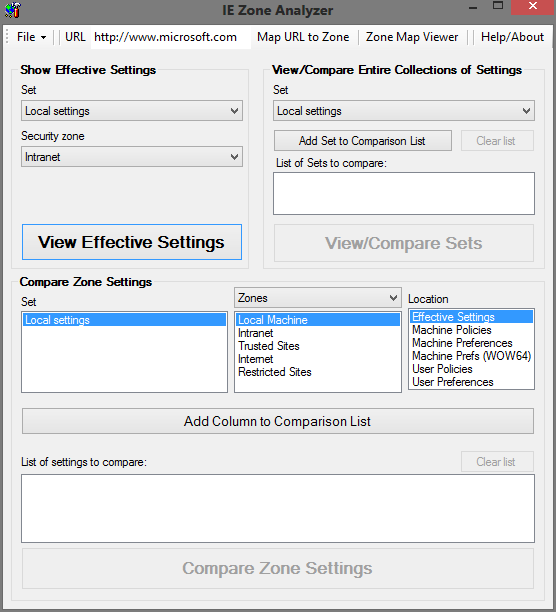
Use IE Zone Analyzer. This tool allows you to review the configuration of zones in great detail, and help with bugs that only appear in certain environments. It is available for free from Microsoft.
At this point you'll be in a better position to debug specific code in IE, but how do you remediate the problem? Well you have to make a change somewhere. It is common for admins to add wildcards like *.domain.com to the Intranet zone. Naturally this will not discriminate between Intranet sites, and cause a lot of problems if you have modern code that doesn't run well under Compatibility View. Try to educate your admins on the appropriate configuration so that your environment will be more secure, and you'll also spend less time debugging!
Thanks to everyone who attended my talk on Production Debugging. You can now download my slides and code samples from the talk. I have listed some questions and answers from the talk at the bottom.
Where can I get Reflector?
It is a free download on Red Gate's site. You don't have to buy the Visual Studio integration. When it starts up you are asked for the version of .NET to use. I always select the latest version as .NET backwards compatibility is good. Of course this can be changed later.
How do you stop someone from decompiling your code with Reflector?
You should be aware that obfuscators can make your life more difficult. One way they make code harder to read in Reflector is through method renaming. This can result in the stack traces from the obfuscated code being out of sync with your code.
Can I use ELMAH with Windows apps?
Not easily. ELMAH relies on various features of ASP.NET to do a lot of it's work. Some people have make their own modifications, but it not something that a beginning developer might want to attempt.
I wrote a sample ages ago called BugBack that works for WinForms. It is old and in need of some love but it is a starting point. If you want an off the shelf solution you should look at Red Gate SmartAssembly.
Microsoft have been collecting crash data using a system known as Windows Error Reporting ("Dr Watson") since the release of Windows XP (and possibly earlier). When a usermode error occurs in an application, a minidump and other pertinent is extracted. The user is then prompted as to whether they wish to report this information. After the reboot that follows a kernal mode error (bugcheck) you are prompted to send this information to a secure Microsoft server.
If the information is reported, a back end process does some analysis to see if it matches other error messages and might offer you some feedback. I've certainly benefited from this in the past, as a buggy D-Link driver caused numerous bugchecks (blue screens) and WER pointed me to a source of newer drivers.
I've observed the use of this feature by many people and there seems to be a fairly even split between those that send the crash data and those who cancel out. It appears that many people don't provide feedback because they fear Microsoft getting getting access to private information. This fear is justifiable, but I think that Microsoft could encourage more people to submit bug reports if they improved their UI design and branding.
The current implementation on Windows XP and 2003 has these faults:
The UI is simplistic. Although it offers some information on why you might submit, it fails to reinforce the benefits.
Technical information cannot be easily copied to the clipboard. It would also be good to be able to save this to a file.
There is little help provided to help decipher the technical information provided.
Lack of Windows UI integration. If you are using a shared computer, an administrator cannot see all of the issues which have been submitted to spot problem applications. The settings for crash reporting are hidden away from most users in the system applet.
If you are offline you cannot submit a report.
Thankfully there are some improvements on the way. Windows Vista will include support for centralised crash reporting management, and improved UI. I will post a review of this in Beta 2 soon. Users of Office 2007 will notice that the bug and usage data collector is more advanced, and allows you to submit later. This is enabled when you sign up for the application improvement programme when prompted in the task notification area.
 Expat Coder